|
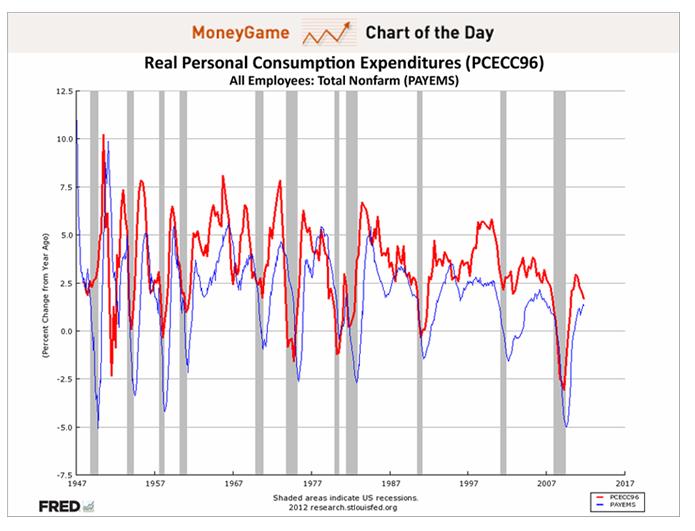
LINKS-ДАЙДЖЕСТ 16 марта 2012 г. Лэкер: ставки необходимо повышать в 2013 г. Еврозона направит Греции транш на 5,9 млрд евро Никос Веттас: Греция - все будет зависеть от выборов Дефицит торговли еврозоны составил 23,8 млрд Вложения РФ в гособлигации США достигли $142,5 млрд Китай увеличил объем вложений в облигации США .................................................................................... теперь англоязычные CHART OF THE DAY: This Is The Chart That Makes ECRI Scream Recession Исследование ECRI показывает, что Америка упорно движется к рецессии. Despite signs that the economy is recovering, research firm ECRI has held to bearish predictions for the U.S. economy. ECRI co-founder Lakshman Achuthan spoke to Bloomberg's Tom Keene this morning to defend his recession call amid an onslaught of criticism. Achuthan provided a deeper look at how exactly ECRI makes its predictions, saying that it focuses on year-over-year indicators for output, employment, income and sales, and the consumer confidence index. 
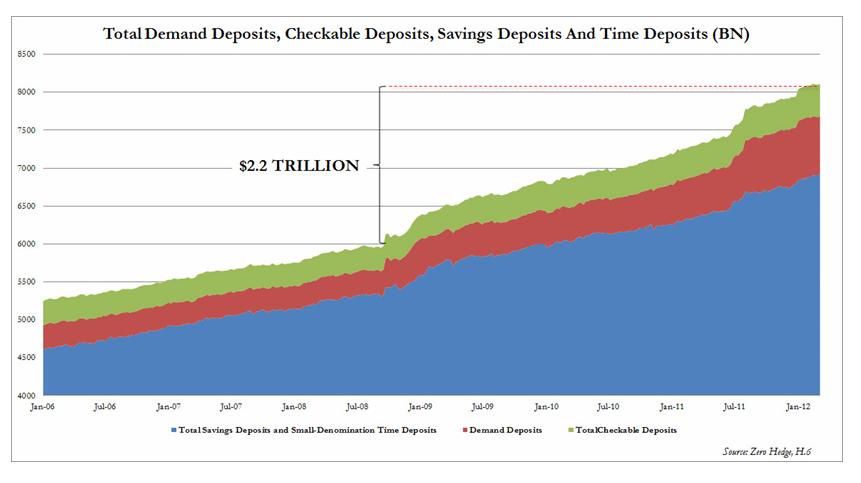
Взаимодействие между потреблением от года к году и занятостью дает явные знаки, что США возвращается в рецессию. In particular, he pointed to the relationship between year-over-year consumption and employment as perhaps the clearest sign that the U.S. is headed back into a recession. "People need to understand the sequence," he said. "I think the hope is that jobs growth will increase consumption in coming months, but in fact jobs growth follows consumption...There are many instances in which job growth precedes a recession." If we look at a graph of these two indicators, it is clear that past U.S. recoveries have virtually all relied on consumption growth... and that consumption growth is slowing down. Gallup Struggles To Explain BLS Jobs Data Gallup пытается объяснить данные по занятости от BLS The latest BLS jobs report and the latest Gallup survey on jobs and unemployment are so out of line, that Gallup has commented on it in followup article Unemployment Numbers Suggest U.S. Economic Boom, or Not Except for the years 2008-2009, and recessions in general, seasonally unadjusted unemployment rate tends to peak in January. Thus it will be interesting to watch Gallup's numbers for the next few months to see if there is a definite change in trend. As it stands now, I do not believe BLS numbers, and neither so it seems, does Gallup. Автор статьи (Mike Shedlock) не верит в цифры BLS, и Gallup, кажется, тоже. ........................................................................................... This Is Where "The Money" Really Is - Be Careful What You Wish For We have long shown that "investors" whatever that term means in the New Normal - those gullible enough to put their money in Bennie Madoff, pardon Bennie Bernanke Asset Management? - have been not only reluctant to put their money into stocks, but despite week after week of artificial, low volume highs, driven entirely by Primary Dealers (and now European banks post the $1.3 trillion in LTROs, not to mention even foreign Central Banks recently buying high beta stocks) spiking the market ever higher courtesy of record reserves, but in fact continue to pull their cash out of the stock market with every thrust higher. Why, just last week another $1.4 billion in cash was pulled from domestic equity funds, nominal Dow 13,000 be damned. The truth is that the banks are desperate to start offloading their risk exposure to retail investors, and instead of selling, are furiously trying to send the market ever higher just to get that ever elusive "investor" back: just look at how much the market rose by last week, CNBC will say: do you really want to be out of this huge rally? Alas, the damage has been done: between the Great Financial Crisis, the Flash Crash, a massively corrupt regulator, rehypothecating assets that tend to vaporize with no consequences, and a central bank which effectively has admitted to running a Russell 2000 targeting ponzi scheme, the investor is gone. But what if? What if the retail herd does, despite everything, come back into stocks? After all the money is in bonds, or so the conventional wisdom states. What harm could happen if the 10 Year yield goes back from 2% to 3%, if the offset is another 100 S&P points. After all it is good for the velocity of money and all that - so says classical economic theory. Well, this may be one of those "be careful what you wish for." Because while investors have indeed park hundreds of billions out of stocks and into bonds, the real story is elsewhere. And the real story is the real elephant nobody wants to talk about. Представляя комбинированный "кэш" Америки: Presenting: America's combined cash hoard, which between total demand deposits, checkable deposits, savings deposits, and time deposits (source H.6), is at an all time high of $8.1 trillion. 
Indicatively, this consolidated number was a modest $5.9 trillion the week when Lehman failed. In other words, in the period in which the Fed dumped $1.6 trillion in cash on Primary Dealers' balance sheets, and gave them a carte blanche to buy NFLX, AAPL, and Crude of course, which they did in keeping with the Fed's Global Put mandate, i.e., no bank will ever fail again, American consumers added $500 billion more than even the Fed parked with the banks, or $2.2 trillion. And therein lies the rub. As a reference, America currently has about $1 trillion of currency in circulation. If, and this is a big if, the gullible US consumer-cum-New Normal investor, does fall for the oldest herding trick in the book, and not only converts their bond holdings but their cash holdings into stocks, which in turn goes right into money velocity, into currency, and thus, into inflation, America may promptly find itself with the most unprecedented inflationary outcome it has ever experienced. Because while the Fed may have control over Excess Reserves, or so it believes, via the interest charged on overnight reserves, it will have absolutely no control over the herd mentality and the avalanche of money, should it proceed to rotate not so much out of bonds into stocks, but far more importantly, out of electronic cash (which for all intents and purposes is the US M2 these days), into the stock market. Will Hungary Be The Next Iceland? PM Orban: "Hungarians Will Not Live As Foreigners Dictate" Венгры не хотят жить под диктат Брюсселя Dylan Grice Explains When To Sell Gold Dylan Grace объясняет, когда продавать золото Industrial Production Misses, Capacity Utilization Declines For First Time Since April 2011 Промышленное производство разочаровало, использование мощностей снизилось впервые с апреля 2011 года. The Fool's Game: Unravelling Europe's Epic Ponzi Pyramid Of Lies Ни одна из цифр, касающихся европейских долгов, не заслуживает доверия. The quoted and much ballyhooed sovereign debt numbers are now known to be no longer accurate and hence the lack of credibility of the debt to GDP data for the European nations. Stated more simply; none of the data that we are given about sovereign debt in the European Union is the truth, none of it. According to Eurostat, as an example, the consolidated Spanish debt raises their debt to GDP by 12.3% as Eurostat also states, and I quote, that guaranteed debt in Europe “DO NOT FORM PART OF GOVERNMENT DEBT, BUT ARE A CONTINGENT LIABILITY.” In other words; not counted and so, my friends, none of the data pushed out by Europe about their sovereign debt or their GDP ratios has one whit of truth resident in the data. Здесь интересные цифры относительно европейской долговой пирамиды Например, по Испании: Spain If we just take the newest figures for Spain, which were released this morning, we find an admitted sovereign debt of $732Bn and a touted debt to GDP ratio of 68.5% which is up 10.7% from last year. Then, according to Phoenix Capital Research, the private sector debt is 227% of GDP while the Spanish banking system is levered 19 to 1. Danske bank points out this morning that the drop in home prices for Spain was -4.2% last quarter which marks the biggest drop ever and they note a record high vacancy rate of 24.3% while further stating that the fall in Real Estate prices is so steep that it is equivalent to a 10% loss in GDP. In a report issued on 2/29/12 and apparently ignored by everyone including the ratings agencies, Eurostat reports that Spain has total sovereign guarantees of “other debt” which is 7.5% of their total GDP which would total around another $72.2 billion in uncounted debt. Then if we consider the “known” debt for Spain, only someone in La Mancha may know the “real” answers, we find: Admitted Sovereign Debt $732 Billion Admitted Regional Debt $183 Billion Admitted Bank Guaranteed Debt $103 Billion Admitted Other Sovereign Guaranteed Debt $ 72 Billion Total Admitted Debt $1.090 Trillion A More Accurate Debt to GDP Ratio 113.2% Just Add Minotaur - The Greek Balance Sheet Labyrinth In All Its Insane Glory Лабиринты греческого баланса во всем его безумном блеске 
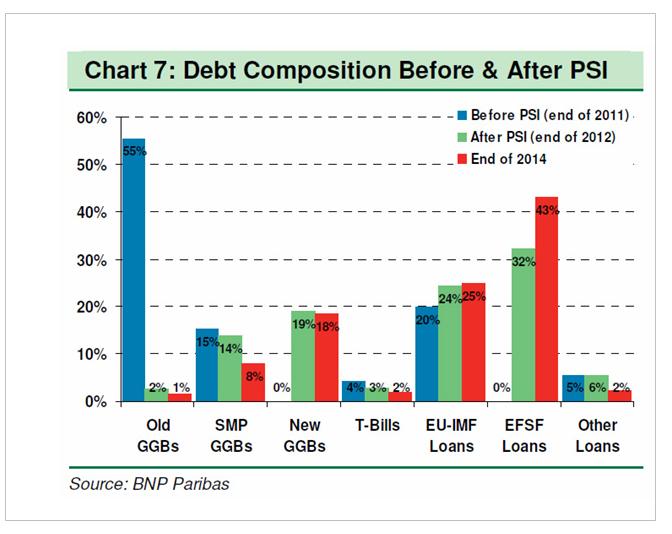
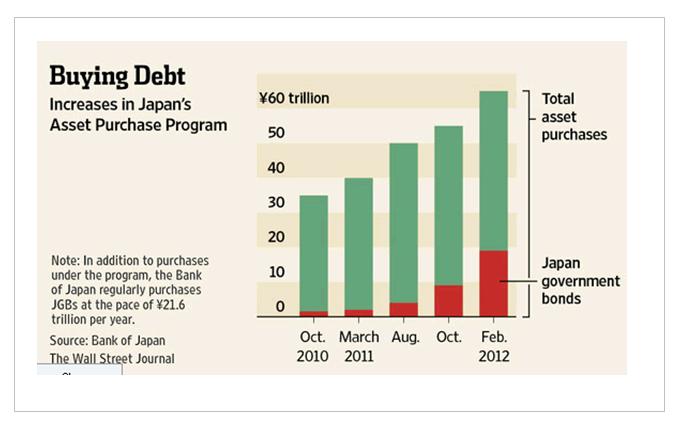
As the BNP chart below shows, following the "successful" completion of the PSI, where we expect quite a few billion in UK-law holdouts to present a substantial headache to Greece as noted yesterday, the country will have not one, not two, not even three distinct debt classes of debt, but a whopping seven! Yup - one country, seven tranches of debt, in order of seniority: 1) EU-IMF Loans; 2) EFSF Loans; 3) SMP GGBs; 4) New GGBs; 5) T-Bills; 6) Old GGBs and 7) Other loans. So when that dealer sells you sovereign bonds from now on, we suggest getting some color on tranching, subordination, ranking, priority, security, guarantee, collateral, and in general everything else that is now forever gone in a post-pari passu world. And this is certainly not just Greece. With all of Europe undergoing the same stealthy "unsecured" debt-to-taxpayer higher lien restructuring, the same will happen in Portugal, Ireland, Spain, Italy, and eventually every other country, as the only real source of cash to keep the European once dream now nightmare alive are taxpayers, who directly have to fund out of pocket any hope of a residual welfare state... which incidentally at a hundred trillion or more in unfunded liabilities, is far more insolvent than Greece ever could be. После реструктуризации PSI вместо трех у Греции стало 7 типов долговых обязательств. Скоро то же самое будет и с другим периферийным долгом. Overnight Bizarro Futures Levitation Driven By Spanish Balance Sheet Deterioration Суверенные долги в еврозоне растут... More disturbing is the "austerity" report out of Spain, where we just learned that total public debt has hit €735 billion at the end of 2011, with regions debt at €140.1 billion, which means that public debt rose to 68.5% of GDP, from 61.2% a year prior. As Peter Tchir says: "We are still in no one cares mode, but the exposure the core has to the periphery is growing by the day. Germany's exposure is growing because of Target 2, and Spain and Italy are busy guaranteeing the debt of their banks. On the surface, all is calm. Below the surface it is messier than ever. They are doing everything possible to keep that mess covered because if it rises to the surface, it will be harder to control than ever before." As a reminder, this is precisely what happened in early 2011... and early 2010. You can only keep trillions of underwater debt under the rug for so long. ........................................................................................... Shift in FX Drivers May Provide Support for the USD Обзор важнейших для валютного рынка событий на будущей неделе. This doesn't mean that we will see a rebound in EURUSD any time soon, even though the single currency had a storming finish to the European session on Friday. Instead it suggests that further declines could be muted and we are back to range trading. As we start a new week the range to note in EURUSD is 1.3050 - 1.3250. Will Japanese Yen Weakness Continue? Продолжится ли слабость японской йены The total amount of the central bank's planned government debt purchase through the end of this year jumped to nearly ¥38 trillion ($465 billion), an amount roughly equal to all the new bond issuance planned by the Japanese government for the period. This is the first time since the program began in October 2010 that central-bank-asset purchases came anywhere near the amount of government new issuance. 
Впервые с запуска программы покупок активов объем запланированной покупки госдолга центральным банком близок к общему объему нового выпуска. Added to looser Japanese monetary policy was the jump in yields seen this week in the US. Therefore we will continue to use this difference in US and Japanese yields is as a guide, and as long as the difference between the 2 continues to remain big enough and continues to widen, that can continue to entice these flows, which should help support further gains in the USD/JPY. At the same time, with the action is not limited to just US assets, and Japanese investors seeking higher yield will look to diversify in European, British, Australia, and other markets, helping to push up the EUR/JPY, GBP/JPY, AUD/JPY. We should also take note of the positive carry trade interest that holding long currency position offers, not to mention the recent change in exchange rate which also benefits big investors and small traders.
| 