|
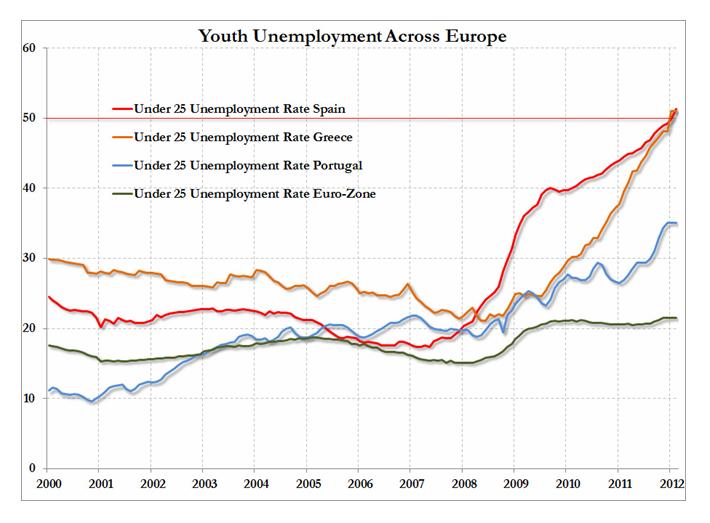
LINKS-ДАЙДЖЕСТ 11 марта 2012 г. Шойбле не дает гарантий спасения Греции .................................................................................... теперь англоязычные China Posts A Record-Shattering Trade Deficit For February Китай показал в феврале самый большой торговый дефицит за 20 лет. China has posted a massive trade deficit for February. The cause was very weak exports, which fell 23.6% month-over-month. The Lunar New obviously had a lot to do with that. For the combined January-February period -- which attempts to blend out the impact of the Lunar New Year crossing two weeks and coming at different times each year -- export growth of 6.8% since the year 2000 (excluding 2009, of course). On the bright side, import growth of 39.6% year over year was far better than the decline of 15.3% in January... this may be a harbinger of a new pickup in exports. In light of the Chinese trade deficit, the Aussie trade deficit, and the Japanese trade deficit, you might be asking as some are: Who has the trade surplus? The answer, we're guessing, is: The oil states. Кто спрашивается в таком случае находится в профиците? Государства – поставщики нефти. Китай продолжил накапливать резервы черного золота в свете предстоящей эскалации конфликта вокруг Ирана. Goldman's Jan Hatzius Gives 2 Reasons Why GDP Will Remain Ugly Экономист Goldman Sachs Ян Хатциус оптимистичен относительно рынка труда, но совсем не так оптимистичен относительно ВВП. Hatzius is not bullish on GDP. Why is our forecast for GDP growth still so muted? Apart from weather and seasonal issues, which are probably less important for the GDP data than for the labor market and the CAI, there are two reasons. One is that indicators of final demand still look quite soft. Final demand (GDP less inventories) grew just 1.1% in Q4 and an estimated 2% in Q1. The other issue is oil. Our models say that a 10% seasonally adjusted gasoline price increase—roughly what we have seen since the second half of 2011—should take an average of 0.4 points off annualized growth over the following year. That's not yet a huge effect, but it is the sort of magnitude that starts to matter from a forecasting perspective. We also don’t think that the low level of natural gas prices will offset much of the increase in gasoline prices; as we showed recently, household and business expenditures on natural gas, evaluated in terms of the commodity cost, are only one-ninth as large as expenditures on oil and oil products as of 2011. This means that changes in oil (and especially gasoline) prices are nine times more important than proportional changes in natural gas prices. HUSSMAN: These 5 Conditions Mean The Market Is Going To Plunge Хуссман выдвигает пять причин, почему рынок должен начать снижаться в ближайшие пять дней. Hussman's bearishness is well known, but the article by Randall W. Forsyth boils down Hussman's bearishness to five criteria: • the Standard & Poor's 500 trading at more than 8% above its 52-week exponential moving average • the S&P 500 up more than 50% from its four-year low • the "Shiller P/E," based on the cyclically adjusted trailing 10-year earnings, developed by Yale economist Robert Shiller, greater than 18; it's currently 22 • the 10-year Treasury yield higher than six months earlier • the Investors Intelligence's bullish advisory sentiment over 47%, and bearishness under 25%; in the latest data, the numbers were 47.9% bulls and 26.6% bears Apparently all those conditions are nearly in place now, as they were in 1987, 2000, and 2007. Meanwhile, Zimmerman agrees with all that, plus he cites the inevitability of a market decline owing to rising taxes, austerity, too much bullishness, and gas prices. He sees a "perfect storm" manifesting itself within days. Guest Post: An Open Letter to Jamie Dimon Открытое письмо главе JPM Europe's Scariest Chart Just Got Scarier Самый страшный график Европы стал еще страшнее. Безработица среди молодых людей до 25 лет 
| 